CHIDINMA ONYEMACHI

ABOUT ME
Hi, I’m Chidinma Onyemachi, a Data Analyst passionate about turning raw data into clear insights that support better decision-making.I work with Excel, Power BI, Tableau, SQL, Python, and ODK, using these tools to clean, analyze, visualize, and communicate data effectively. I also have an interest in Monitoring, Evaluation & Learning (MEL) and using data to understand performance and identify areas for improvement.I enjoy going beyond simply creating reports. I like asking questions, finding patterns, validating results, and turning analysis into a story that people can understand and use.I’m continuously building my skills, taking on new analytical challenges, and growing as a data professional.My goal is simple: use data to make complex information clearer and decisions smarter.
Tools: Excel • Power BI • Tableau • SQL • Python • ODKSkills: Data Analysis • Data Cleaning • Data Visualization • Dashboard Development • Data Validation • KPI Reporting • Data Transformation • Monitoring, Evaluation & Learning (MEL)
FEATURED PROJECTS
Nigeria Food Price Analysis
Project Overview
An interactive Power BI project analyzing food price trends across Nigerian states and markets using World Food Programme food price data.The dashboard explores commodity price movements, market differences, geographic price distribution, and price volatility to help users understand food price patterns across Nigeria.
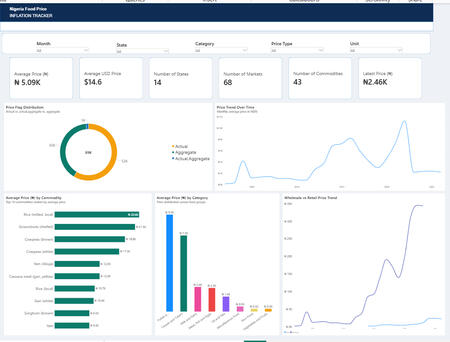
Business ProblemFood prices vary across locations, commodities, and time. This project provides an interactive way to compare markets, track price movements, and identify areas where prices may require further investigation.Tools & SkillsPower BIPower QueryDAXData Cleaning and TransformationData ModelingKPI DevelopmentInteractive Data Visualization
Dashboard Pages1. Market Price OverviewFood price indicators and monthly price movementsPercentage change over timeHigh-level price comparisons
2. Commodity & Market AnalysisCommodity price comparisonsMarket price rankingsCommodity price volatilityWholesale–retail price differences
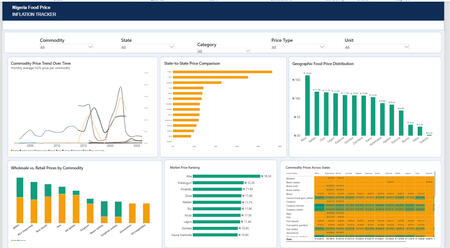
3. Price Trends & Geographic IntelligenceState-level price comparisonsGeographic food price distributionPrice trends across locations
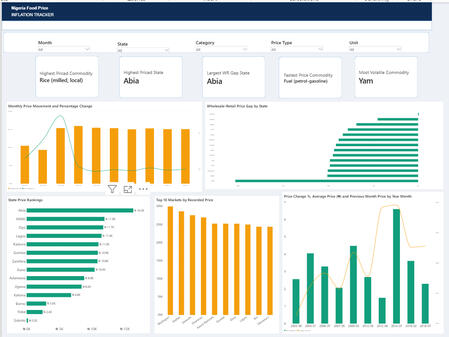
Business ValueThe dashboard helps users explore regional food price differences, compare commodities and markets, and identify price patterns that may inform further research and decision-making.
Healthcare Analytics
Power BI | DAX | Power Query | Data Visualization
The Project
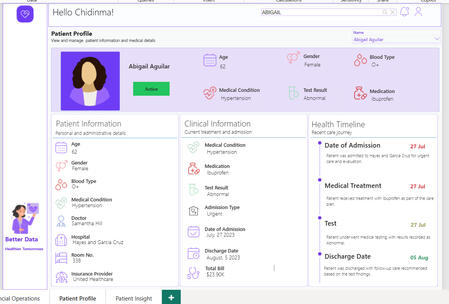
An interactive healthcare dashboard analyzing patient profiles, medical conditions, admissions, test outcomes, hospital activity, and billing performance.
Key AnalysisAnalyzed patient demographics, medical conditions, admissions, and test outcomes.
Examined hospital activity and billing patterns.
Built patient-level analysis to track the journey from admission to discharge.
Used DAX and Power Query to create interactive KPIs and time-based analysis.
Key Findings
Identified the most frequently recorded medical conditions and test-result patterns.
Revealed differences in hospital activity and billing across the dataset.
Enabled individual patient records to be explored alongside broader population patterns.
Connected patient, operational, and financial information in one dashboard.
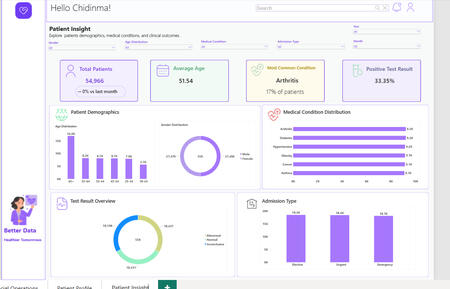
Business SolutionI developed an interactive Power BI dashboard that combines patient, hospital, admission, test-result, and billing data into one analytical view. The solution helps healthcare teams monitor key KPIs, explore patient journeys, identify operational patterns, and analyze financial activity through interactive filters.
HealthConnect Clinic Experience Lab
Healthcare Appointment & No-Show Analysis
Tools: Power BI | Excel | Data Analytics
The Project
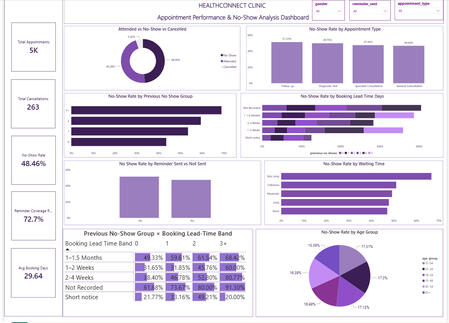
As part of the HealthConnect Clinic Experience Lab, I analyzed 5,000 clinic appointment records from January 2025 to June 2026 to identify patterns associated with patient no-shows and support operational decision-making
Key AnalysisPrevious no-show history
Booking lead time
Reminder status & channel
Appointment type
Distance to clinic
Age group
Appointment outcomes
Monthly trendsKey FindingsPrevious no-show history was one of the strongest observed patterns. Across appointment types, higher previous no-show history was consistently associated with higher observed no-show rates.The relationship between reminder status and no-shows varied by appointment type, so I refined the interpretation rather than presenting reminders as having a uniform relationship with no-shows.Testing & ValidationI tested the dashboard and analysis across different segments to validate the findings:Reminder Status × Appointment Type
Appointment Type × Previous No-Show History
Previous No-Show History × Booking Lead TimeThis helped me identify where interpretations needed refinement and where findings remained consistent.Key LearningGood analytics isn't just about finding patterns. It's about testing them, questioning them, and communicating them responsibly.